S&P500 Daily Action Areas & Price Targets 24/7/26

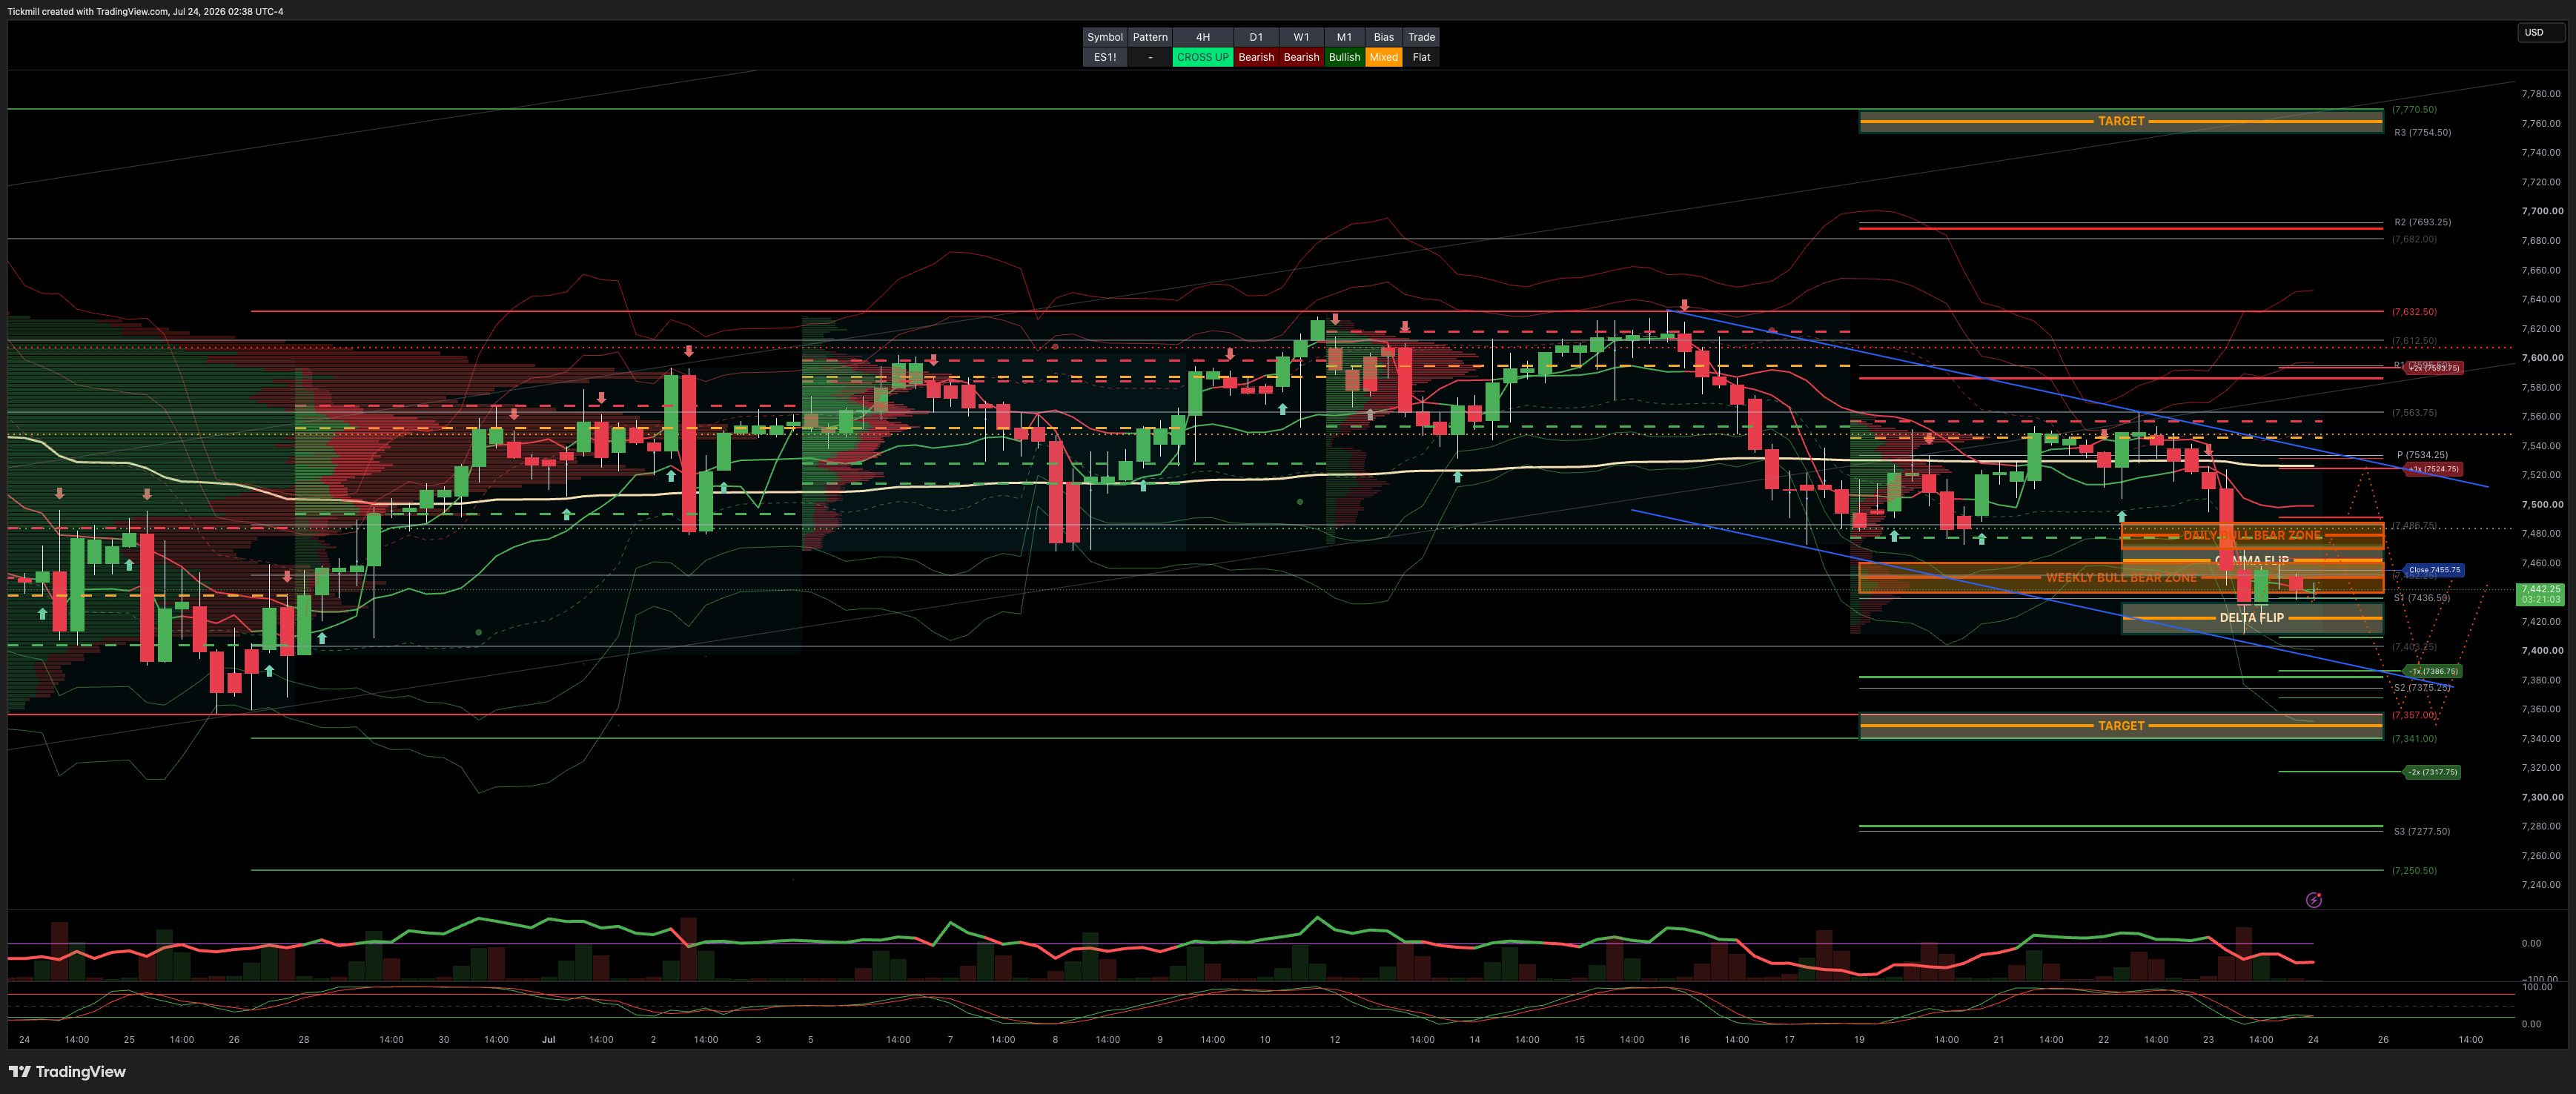
S&P500 Daily Action Areas & Price Targets 24/7/26
***QUOTING ES1! FOR CASH US500 EQUIVALENT LEVELS, SUBTRACT POINT DIFFERENCE***
WEEKLY BULL BEAR ZONE 7460/40
WEEKLY RANGE RES 7632 SUP 7358
MONTHLY RANGE RES 7838 SUP 7258
JHEQX Q3 Collar Short Call Cap: ~7,750 – 7,900 - Long Put Strike: ~7,050 – 7,100 (approx. 5% downside protection) Short Put Strike: ~5,950
DEC2025 OPEX to DEC2026 OPEX is 945 points giving us a range of [5889,7779]
SPX PUT/CALL RATIO 1.10 (The numbers reflect options traded during the current session.) A put-call ratio below 0.7 is generally considered bullish, and a put-call ratio above 1.0 is generally considered bearish.
GS Flow Desk: large S&P 31Aug 7000/7950 strangle in roughly $20mm vega / $115mm premium …My Read – classic “big convexity versus carry” trade: either someone paid a lot to own a wide August move, or someone got paid a lot to bet that the S&P stays comfortably inside the 7000–7950 corridor
DAILY VWAP BEARISH 7494
WEEKLY VWAP BEARISH 7563
MONTHLY VWAP BULLISH 7036
DAILY STRUCTURE - OTFL - 7486
WEEKLY STRUCTURE - BALANCE 7648/7247
MONTHLY STRUCTURE - OTFH - 7247
Balance: This refers to a market condition where prices move within a defined range, reflecting uncertainty as participants await further market-generated information. Our approach to balance includes favouring fade trades at the range extremes (highs/lows) while preparing for potential breakout scenarios if the balance shifts.
One-Time Framing Higher (OTFH): This represents a market trend where each successive bar forms a higher low, signalling a strong and consistent upward movement.
One-Time Framing Lower (OTFL): This describes a market trend where each successive bar forms a lower high, indicating a pronounced and steady downward movement.
DAILY BULL BEAR ZONE 7475/85
GAMMA FLIP 7462
DELTA FLIP 7422
DAILY RANGE RES 7523 SUP 7376
2 SIGMA RES 7591 SUP 7320
VIX BULL BEAR ZONE 17.9
TRADES & TARGETS
SHORT ON REJECT/RECLAIM DAILY RANGE BULL BEARS ZONE TARGET WEEKLY RANGE SUP
LONG ON REJECT/RECLAIM WEEKLY RANGE SUP TARGET DAILY BULL/BEAR ZONE
***ADDITIONAL SETUPS & TARGETS HIGHLIGHTED ON THE CHARTS***
(I FADE TESTS OF 2 SIGMA LEVELS ESPECIALLY INTO THE FINAL HOUR OF THE NY CASH SESSION AS 90% OF THE TIME WHEN TESTED THE MARKET WILL CLOSE ABOVE OR BELOW THESE LEVELS)
NOMURA CROSS ASSET TRADING DESK VIEWS
Nomura / McElligott — Crude → Rate Vol → Fed Credibility → Cross-Asset Vol Squeeze
The note’s core message is that the market has moved from an “earnings micro calm” into a more dangerous macro-vol regime. Iran escalation is pushing crude higher, crude is feeding rates vol, rates vol is tightening financial conditions, and that threatens to put the Fed in a very difficult position into next week’s meeting.
The framework is not simply “the market is pricing a July hike.” The more nuanced read is that rates may be throwing a mini-tantrum: a hawkish hold may no longer be sufficient if crude continues to reprice the inflation tail. That raises the risk that the Fed is perceived as behind the curve now, which would increase the probability of more aggressive over-hiking later.
The key phrase remains: all assets / market beta are short rate volatility.
1. Iran Escalation Reopens the Crude Shock
Iran escalation headlines are feeding already poor cross-asset sentiment. The market had become desensitized to repeated “ceasefire MOU v33.0” headlines, but now the escalation path looks harder to fade:
Trump reportedly said he is seriously considering restarting major combat operations in Iran.
Energy is running higher.
Crude is again feeding the rate-vol impulse.
There is no obvious off-ramp yet.
That creates a messy setup for both markets and the Fed into next week’s meeting.
The transmission channel is the same one flagged earlier:
Crude Shock→Inflation Tail→Rate Vol→Hawkish CB Repricing→Cross-Asset VolCrude Shock→Inflation Tail→Rate Vol→Hawkish CB Repricing→Cross-Asset Vol
Crude is now again “the straw that stirs the drink.”
2. Rates Are Not Simply Pricing a July Hike — They May Be Throwing a Mini-Tantrum
Optically, the last two days of USD rates price action may look like the market is pricing a July hike, especially after the Warsh press conference was added and triggered a buyside rethink. Warsh’s own phrase — “when the Fed speaks, it should mean something” — matters because markets are re-evaluating the Fed’s reaction function.
But the note argues this “July hike” interpretation is too simplistic. The Fed could just as easily use recent soft CPI and PPI to justify no action, while delivering a hawkish hold.
The bigger issue is that the market may be saying a hawkish hold is not enough.
Why? Because crude is rising, energy is feeding inflation-risk premium, and the Fed already faces latent credibility / independence concerns tied to Warsh / Trump dynamics. If the Fed does not act, markets may increasingly price a “behind the curve on inflation” policy mistake.
That creates a left-tail risk: the Fed does not hike now, inflation expectations worsen, and the market begins to price more aggressive hikes later.
This is the “anticipate the anticipators” dynamic. Rates are trying to front-run how the Fed will respond to the market’s own repricing.
3. Crude Is Tightening Financial Conditions Through Real Rates
The “now” issue is that crude is making the rates move self-fulfilling. Higher energy prices are feeding a more violent move higher in rates, especially real yields. Real yields are a cleaner proxy for tighter financial conditions.
That matters because if the market leads financial conditions tighter, it can trap the Fed. Warsh may not want to hike immediately after soft inflation prints, but if crude and rates continue higher, the market may force him toward a more hawkish stance.
This is the risk loop:
Higher Crude→Higher Inflation Risk→Higher Real Yields→Tighter Financial Conditions→Fed TrappedHigher Crude→Higher Inflation Risk→Higher Real Yields→Tighter Financial Conditions→Fed Trapped
The result is a more fragile cross-asset environment.
4. The Earnings Micro Calm Is Still Working — But It May Not Be Enough
The original sequencing was:
Constructive earnings micro keeps equities sane.
Positioning rebuilds after the de-grossing / momentum unwind.
AI enablers and bottlenecks outperform hyperscalers.
Equities grind higher first.
Later, rebuilt positioning plus August liquidity creates a vol event.
Part of that is still happening. The AI enablers / bottlenecks versus hyperscalers long/short is working dramatically, up 6.2% early session. That means many portfolios can still have a solid performance day even if headline indices are down.
GOOGL capex upside appears to sustain the “enablers / bottlenecks > hyperscalers” trade. In other words, the market is rewarding the picks-and-shovels beneficiaries of AI capex, even as hyperscalers themselves become the funding leg.
But the key index-level problem is that the S&P and NDX cannot make new highs if hyperscalers are down. Their market-cap weight is too large. Hyperscalers are effectively the “funding short” in the AI trade, and if they are falling, the index loses its stabilizer.
So the prior expectation of “grind higher first, vol later” may be compressing. The index may weaken sooner if hyperscaler weakness overwhelms AI enabler strength.
5. Index Level Risk: Hyperscalers Are Too Big to Ignore
This is one of the most important equity points in the note:
Equity indices cannot make new highs when hyperscalers are falling.
The AI trade can still work underneath the surface:
Long AI enablers
Long bottlenecks
Long semicap / power / infrastructure
Short hyperscalers
Short AI losers
But that is not the same as broad index upside. Because hyperscalers are enormous index weights, weakness there can dominate the SPX / NDX even if the AI thematic long/short is profitable.
This is why the market can have:
Good thematic performance
Strong single-name dispersion
Positive “picks and shovels” reaction
But weak headline index
That is the index-vol risk: the offsetting internal rotation may no longer be enough to hold the index.
6. CTA Risk Is Coming Back Into Play
A key de-risking flow that has not mattered for some time may now re-enter the picture: CTA trend.
In the Nomura QIS Trend model, the 3-month window is by far the largest weighting in the major US equity futures signals, accounting for 52.6% of the aggregate signal.
Current signal loadings:
Index Future | Current CTA Signal |
|---|---|
S&P futures | +100% long |
NDX futures | +90% long |
Russell futures | +90% long |
The issue is that the 3-month long signal is becoming more tenuous. It has moved from deeply in-the-money toward local short triggers as stocks sell off. The risk is not only a fast break lower; even a slow grind lower can drag prices deeper into the 3-month window and eventually flip the overall CTA model short.
The projected notional matters most in S&P futures. If the signal flips as currently modeled, the potential sale could be roughly:
−$25.5bn−$25.5bn
The note’s phrase — “like a basketball through a garden hose” — captures the liquidity risk. A forced systematic sale of that size into August liquidity could amplify downside and finally create the index-vol event that has been absent.
7. Rate Vol Is Already Percolating
USD rate vol is moving higher across the grid. The largest changes are concentrated in the front-left and intermediate expiries, consistent with the Fed / crude / policy-error repricing.
Examples of week-to-date changes:
Expiry / Tenor | 1Y | 2Y | 5Y | 10Y | 20Y | 30Y |
|---|---|---|---|---|---|---|
1m | +9.3 | +9.1 | +8.0 | +5.8 | +5.1 | +3.8 |
3m | +8.6 | +9.1 | +6.5 | +4.6 | +3.7 | +3.6 |
6m | +6.0 | +6.7 | +4.8 | +3.5 | +3.0 | +3.0 |
1y | +6.7 | +6.4 | +3.5 | +3.2 | +3.5 | +3.5 |
The front-end repricing matters most because it reflects renewed uncertainty around the Fed reaction function. If rates vol keeps rising, equity vol can no longer remain insulated forever.
8. VIX Upside Is the Cleaner Expression — But It Is Moving
The note reiterates that VIX upside has attractive risk/reward, though it has already started moving. The reason is the combined setup:
Crude shock
Rate vol impulse
Fed policy-error risk
August seasonality
Low liquidity / low risk tolerance
Crowded dispersion
Low index vol
Sticky VVIX
Potential CTA sell flow
Customer interest is increasingly focused on VIX upside structures:
Calls
Call spreads
Call flies
Dealers are not yet in a major short-convexity problem, because many short strikes are in the tame 20s–30s and dealers still have plenty of long VIX gamma above that. But incremental client demand for VIX calls moves the market closer to a future short-convexity issue.
A large VIX tail roll went up:
Leg | Trade |
|---|---|
Bought | 95k VIX Aug 45 calls @ 0.34 |
Sold | 200k VIX Aug 65 calls @ 0.17 |
Sold | 95k VIX Sep 45 calls @ 0.70 |
Bought | 220k VIX Sep 65 calls @ 0.39 |
This is effectively a tail trade rolling from August into September, extending protection into a potentially more fragile late-summer / post-earnings window.
9. Dispersion Traders Are the Potential Source of VIX Call Demand
The likely source of future VIX call demand is the crowded dispersion community.
The classic dispersion trade is:
Long single-name vol
Short index vol
That trade has worked because single-name volatility has been rich and index volatility has been suppressed by low correlation. But if correlation rises toward “Corr 1,” the short index-vol leg becomes dangerous. The natural hedge is to buy VIX upside.
That is why:
VVIX remains sticky around 105
Investors are reaching for tails
VIX call skew remains elevated
Index vol can squeeze if correlation rises
The dispersion trade is currently in-the-money, but it is also crowded. If macro stress causes correlations to rise, the short index-vol leg can get squeezed “in their mush,” forcing more VIX call demand and amplifying the move.
10. Caveat: VIX Calls Are Hard to Monetize
The note is realistic about the downside of VIX upside. VIX call monetization is notoriously difficult because investors are conditioned to sell vol rips quickly. If the macro scare does not escalate and AI earnings remain robust, then vol can bleed.
There is a plausible TACO scenario:
Macro headlines intensify
Vol spikes
But then crude / Iran settles down
Earnings remain strong
Markets chop sideways
Rich vol bleeds
In that environment, VIX downside could become attractive after a squeeze.
So VIX upside is not a set-and-forget trade. It likely needs the rates / crude feedback loop to stay stressy before the expected TACO arrives.
Trading Framework
Near-Term Equity View
The index setup has deteriorated. The AI enablers / bottlenecks trade can still work, but headline indices struggle if hyperscalers remain weak.
Implication: favor relative value over outright index longs.
Preferred equity expressions:
Long AI enablers / bottlenecks vs. short hyperscalers
Long semicap / power / infrastructure beneficiaries
Avoid assuming SPX / NDX can make new highs while hyperscalers are down
Keep QQQ / SPX hedges live
Vol View
VIX upside remains attractive, though less clean after the initial move.
Preferred vol expressions:
VIX call spreads
VIX call flies
Calendarized VIX upside into September
SPX / QQQ downside convexity around earnings / Fed
Consider monetizing if vol spikes but crude stabilizes
Macro Watch
The key variables are:
Crude — must remain bid for the vol-higher thesis to keep working.
Rates vol — the transmission channel into all assets.
Fed meeting — Warsh needs to thread a narrow needle.
Hyperscalers — index cannot break out if they remain the funding short.
CTA triggers — especially the 3-month SPX signal.
VVIX — sticky near 105 signals tail demand.
Correlation — a rise would squeeze index vol and stress dispersion trades.
Disclaimer: The material provided is for information purposes only and should not be considered as investment advice. The views, information, or opinions expressed in the text belong solely to the author, and not to the author’s employer, organization, committee or other group or individual or company.
Past performance is not indicative of future results.
High Risk Warning: CFDs are complex instruments and come with a high risk of losing money rapidly due to leverage. 68% and 74% of retail investor accounts lose money when trading CFDs with Tickmill UK Ltd and Tickmill Europe Ltd respectively. You should consider whether you understand how CFDs work and whether you can afford to take the high risk of losing your money.
Futures and Options: Trading futures and options on margin carries a high degree of risk and may result in losses exceeding your initial investment. These products are not suitable for all investors. Ensure you fully understand the risks and take appropriate care to manage your risk.
Patrick has been involved in the financial markets for well over a decade as a self-educated professional trader and money manager. Flitting between the roles of market commentator, analyst and mentor, Patrick has improved the technical skills and psychological stance of literally hundreds of traders – coaching them to become savvy market operators!