SP500 LDN TRADING UPDATE 13/3/26

SP500 LDN TRADING UPDATE 13/3/26
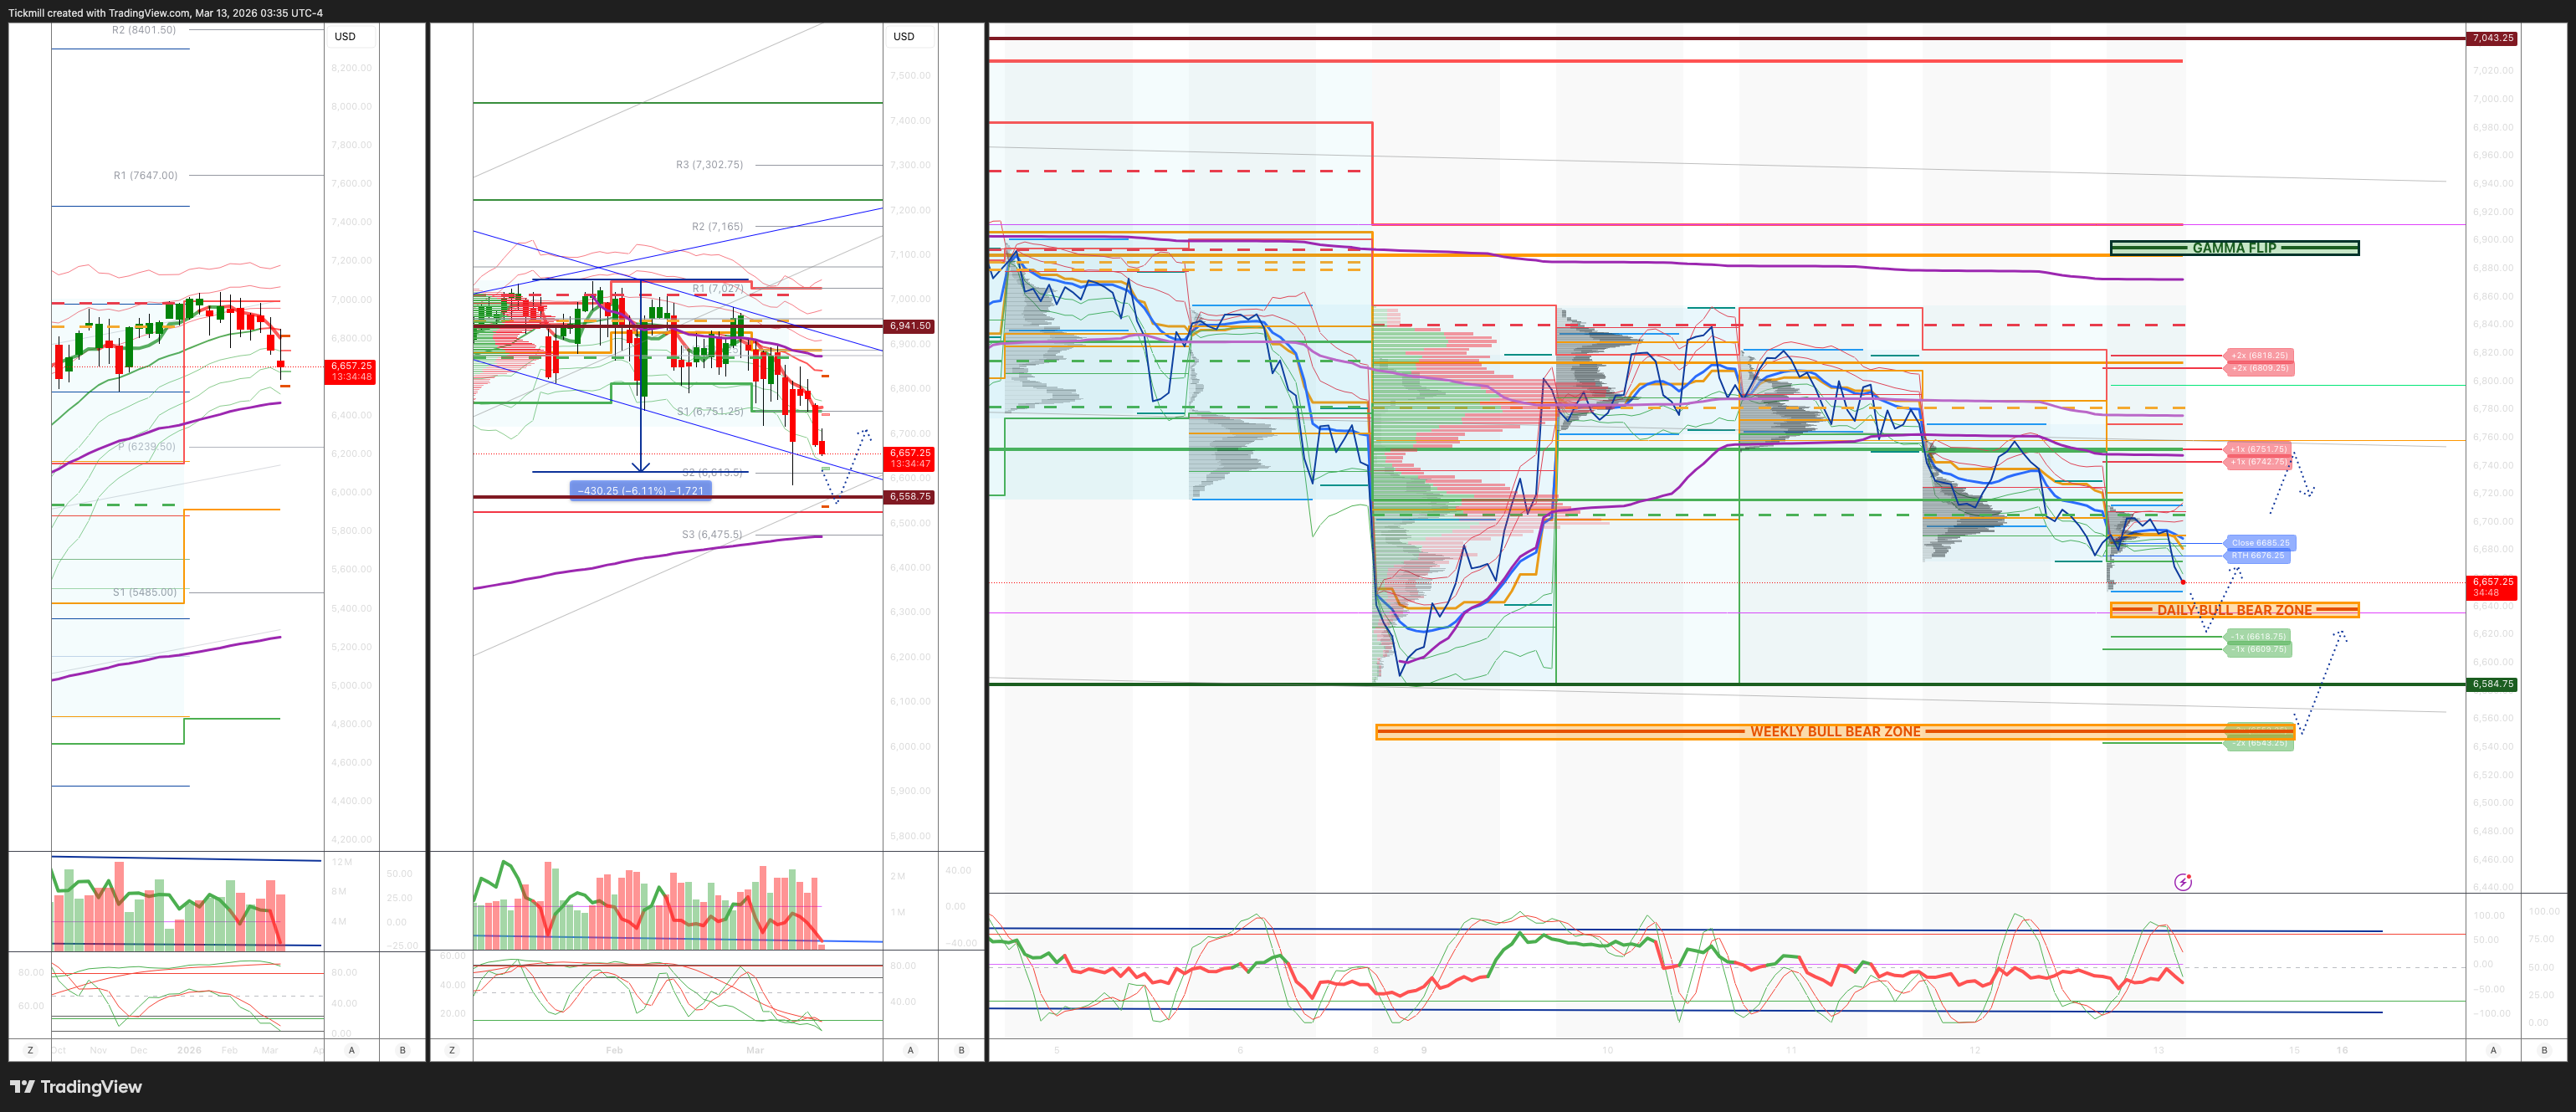
WEEKLY & DAILY LEVELS
***QUOTING ES1! FOR CASH US500 EQUIVALENT LEVELS, SUBTRACT POINT DIFFERENCE***
WEEKLY BULL BEAR ZONE 6560/50
WEEKLY RANGE RES 6942 SUP 6558
Weekly Straddle Range: 192 -point straddle implies a weekly range of [6558, 942]; monitor 1.5x and 2x moves for key reactions.
March OPEX Straddle: 232.8-point range suggests OPEX-to-OPEX movement between [6677, 7142].
March QOPEX Straddle: 368.55-point range projects [6466, 7203], based on December OPEX.
March EOM Straddle: 255.4-point straddle indicates a monthly range of [6623, 7101]. .
DEC2025 to DEC2026 OPEX straddle spans 945 points, outlining a range of [5889, 7779]."
DAILY VWAP BEARISH 6759
WEEKLY VWAP BEARISH 6868
MONTHLY VWAP BEARISH 6889
DAILY STRUCTURE – BALANCE - 6641/6877
WEEKLY STRUCTURE – OTFD - 6911
MONTHLY STRUCTURE - OTFD
Balance: This refers to a market condition where prices move within a defined range, reflecting uncertainty as participants await further market-generated information. Our approach to balance includes favouring fade trades at the range extremes (highs/lows) while preparing for potential breakout scenarios if the balance shifts.
One-Time Framing Higher (OTFH): This represents a market trend where each successive bar forms a higher low, signalling a strong and consistent upward movement.
One-Time Framing Lower (OTFD): This describ@es a market trend where each successive bar forms a lower high, indicating a pronounced and steady downward movement.
DAILY BULL BEAR ZONE 6645/35
GAMMA FLIP 6899
DAILY RANGE RES 6809 SUP 6
2 SIGMA RES 6912 SUP 6646
VIX BULL BEAR ZONE 20
PUT/CALL RATIO 1.16 (The numbers reflect options traded during the current session. A put-call ratio below 0.7 is generally considered bullish, and a put-call ratio above 1.0 is generally considered bearish)
TRADES & TARGETS
LONG ON REJECT/RECLAIM OF DAILY BULL BEAR ZONE TARGET RTH CLOSE > DAILY RANGE RES
LONG ON REJECT/RECLAIM WEEKLY BULL BEAR ZONE TARGET DAILY BULL BEAR ZONE
(I FADE TESTS OF 2 SIGMA LEVELS ESPECIALLY INTO THE FINAL HOUR OF THE NY CASH SESSION AS 90% OF THE TIME WHEN TESTED THE MARKET WILL CLOSE ABOVE OR BELOW THESE LEVELS)
GOLDMAN SACHS TRADING DESK VIEW - ‘Choppy’
S&P closed down 152bps at 6,673 with a Market-On-Close (MOC) imbalance of $560 million to buy. The Nasdaq 100 (NDX) dropped 173bps to 24,534, the Russell 2000 (R2K) fell 212bps to 2,489, and the Dow declined 156bps to 46,678. Total trading volume across all U.S. equity exchanges reached 20 billion shares, exceeding the year-to-date daily average of 19.65 billion shares. The VIX rose 12.65% to 27.29. WTI crude surged 10.15% to $96.13, the U.S. 10-year yield increased by 3bps to 4.26%, gold declined 171bps to $5,088, the dollar index (DXY) gained 50bps to 99.73, and Bitcoin dipped 34bps to $70,398.
Equities traded lower as Brent crude climbed past $100, with markets reacting to a mix of Middle Eastern geopolitical developments. Iran’s Supreme Leader Khamenei stated the Strait of Hormuz should remain closed, but Iran’s Deputy Foreign Minister later denied that mines were being laid in the strait. Additionally, headlines emerged about former President Trump considering suspending the Jones Act, which mandates that goods transported between U.S. ports be carried by U.S.-flagged ships, in an effort to address rising oil prices.
Trading activity on the floor was subdued, registering a 4 on a 1-10 scale. The floor closed down 266bps for sale, compared to the 30-day average of +64bps. Long-only funds were net buyers by $2 billion, while hedge funds were net sellers by $3 billion, primarily driven by broad supply in technology, macro, and communication services sectors (short exposure outweighing long positions). Single-stock flows remained relatively muted given the heightened volatility, with ETFs accounting for over 35% of trading volume. However, activity picked up around dislocations (e.g., ORCL and UBER yesterday), thematic trades across sectors (notably in private credit supply), and sporadic megacap source-of-fund trades (e.g., GOOGL and AMZN supply yesterday). Software covering from last week has subsided, with flows in that space much quieter.
Goldman Sachs Investment Research (GIR) has shifted its forecast for the Federal Reserve’s first rate cut from June to September, with a second cut expected in December, bringing the terminal rate to 3-3.25%. A higher inflation trajectory could delay the Fed’s ability to begin cutting rates. GIR has also raised its Brent and WTI price forecasts for Q4 2026 to $71 and $67, respectively (up from $66 and $62), now assuming 21 days (versus 10 days previously) of reduced Strait of Hormuz oil flows at 10% of normal levels, followed by a 30-day gradual recovery.
In derivatives, trading flows on the desk were slower despite the significant move lower in spot prices, reflecting ongoing headline fatigue. Volatility was bid along the curve, particularly in the front end, with a stark skew crush accompanying the spot decline. The Russell 2000 stood out, with front-end volatility notably bid and trading 8 vols above the S&P 500. Demand for protection remains strong, with investors rolling out hedges. Interestingly, there was outsized demand for short-dated downside protection in IWM, which was surprising given current volatility levels and the sensitivity of SPX and VIX to geopolitical developments. Looking ahead, markets are anticipating tomorrow’s PCE and JOLTS reports, with an implied move of 1.17% expected by the close.
Disclaimer: The material provided is for information purposes only and should not be considered as investment advice. The views, information, or opinions expressed in the text belong solely to the author, and not to the author’s employer, organization, committee or other group or individual or company.
Past performance is not indicative of future results.
High Risk Warning: CFDs are complex instruments and come with a high risk of losing money rapidly due to leverage. 69% and 73% of retail investor accounts lose money when trading CFDs with Tickmill UK Ltd and Tickmill Europe Ltd respectively. You should consider whether you understand how CFDs work and whether you can afford to take the high risk of losing your money.
Futures and Options: Trading futures and options on margin carries a high degree of risk and may result in losses exceeding your initial investment. These products are not suitable for all investors. Ensure you fully understand the risks and take appropriate care to manage your risk.
Patrick has been involved in the financial markets for well over a decade as a self-educated professional trader and money manager. Flitting between the roles of market commentator, analyst and mentor, Patrick has improved the technical skills and psychological stance of literally hundreds of traders – coaching them to become savvy market operators!